
- Matryoshka Representation Learning (MRL) is not lossless. On our eval harness, every MRL-trained configuration of
zembed-1sat on the same strictPareto frontier. This frontier is structural: you can slide along it; you can’t move it. A learned, post-hoc projection dominates the entire MRL frontier — at full dim and at simultaneously. - Why isn’t this visible in the public literature? As we’ve discussed before, public benchmarks are often an imperfect instrument for detecting nuanced regressions between frontier models. On overall MTEB , top models cluster within 1–2 points. Our own
zerank-1andzerank-1-small, differing by an order of magnitude in parameters, vary by less than 1% on public evals. On our internal benchmark, the same two models differ by more than 10%. - We ship six projection matrices for
zembed-1, available on HuggingFace. Use them yourself with the code below — or passdimensionsto thezembed-1API, and we’ll do it for you.
Matryoshka Representation Learning (Kusupati et al., 2022) is one of the most enticing ideas in modern embedding training: train your model so that the first text-embedding-3 family does it, Voyage’s 3 and 4 familes do it, Cohere, Jina, Gemini — everyone does it. The conventional wisdom, stated plainly in the original paper, is that MRL is “as accurate as the independently trained counterparts.”
When we trained an MRL variant of zembed-1 — our 4B multilingual embedding model , released last month — and measured it against our internal evals, built from real-world retrieval traffic, that wasn’t what we saw.
The Pareto curve we couldn’t escape
Here is the picture that ended the discussion internally:
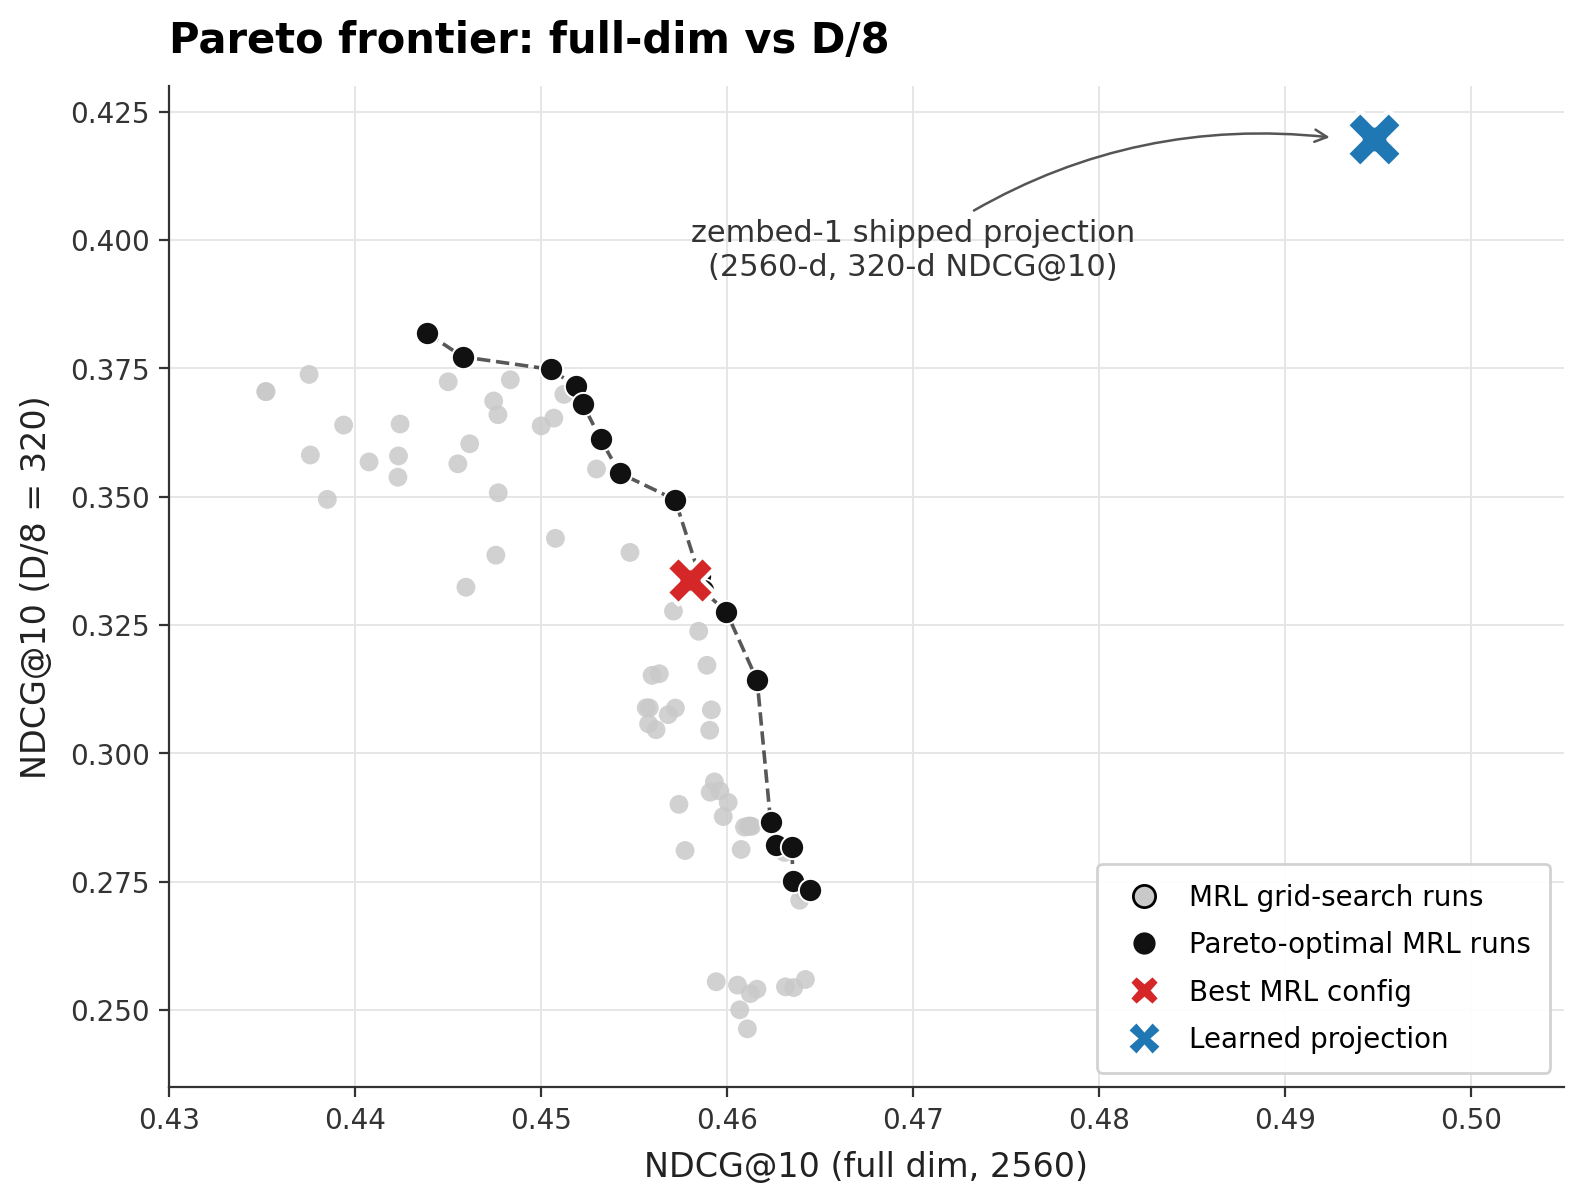
The blue X isn’t a different point on the same curve. It’s a different curve.
We ran a dense grid over MRL’s hyperparameters — matryoshka weight zembed-1 with a matryoshka objective on top of our existing reranker-distillation KL-divergence . For each run, we benchmark the full 2560-dim representation and the
The frontier is tight and reproducible. Every run we’ve done — MLP-only post-training, full 4B-parameter post-training, and pretraining from scratch — lands on the same curve within noise. You cannot train your way through this wall by tuning hyperparameters. You can only pick where on the wall to sit.
And the wall sits well below the alternative.
MRL weight slides you along the frontier — it doesn’t move it
The clearest way to see this is to color the same scatter by

The hyperparameter panel makes the structural nature of this tradeoff even starker. Most of the

Training dynamics tell the same story: the best configurations hit their
Why the literature calls this “lossless”
If MRL is paying for its truncation properties with full-dim performance, why doesn’t this show up in the public benchmarks everyone reports?
Three reasons:
First, public benchmarks are not sensitive enough at the frontier. On the overall MTEB average, the top models cluster within 1–2 points. Our own zerank-1 and zerank-1-small, which differ by an order of magnitude in parameter count, differ by less than 1% on public evals. On our internal benchmark — a representative sample of real-world traffic across finance, healthcare, legal, code, and conversational domains — the same two models differ by more than 10%. Public benchmarks are the right instrument for coarse ranking; they are the wrong instrument for detecting a 2-point regression on the full-dim representation of a frontier model.
Second, the original MRL paper never tested text retrieval. Kusupati et al. evaluate retrieval exclusively on ImageNet-1K and ImageNet-4K image retrieval. No MS MARCO , no BEIR , no MTEB. The “as accurate as independently trained counterparts” claim is specifically a classification claim on ImageNet, at the noise floor of that benchmark. The translation of that claim to text retrieval is an inductive leap the field made on the provider side, not in the literature.
Third, we aren’t the only ones measuring the tax. Wen et al. (2025) conclude that MRL is “a costly and lossy method for adaptive representation,” and propose replacing it with sparse coding. SMEC (EMNLP 2025) frames the problem from a different angle — a learned per-dimension importance gate on top of MRL-trained embeddings — but reaches the same diagnosis: MRL’s nested loss leaves recoverable information on the table. Marqo’s CLIP + MRL study finds that a pre-truncation linear projection beats MRL on novel-document and zero-shot splits at small dimensions — consistent with the pattern we see in text retrieval.
The academic ground has been shifting for a year. We think the shift should be faster.
What MRL actually does to the embedding geometry
MRL concentrates information in the early dimensions by design. What’s less obvious is that this concentration is physical — it shows up in measurable changes to the geometry of the embedding space.
On our 2560-dim embeddings, MRL training nearly eliminates the long tail of strongly correlated dimension pairs (pairs with
This is the underlying accounting. MRL doesn’t create free capacity at small dimensions. It redistributes capacity that was previously spread across all 2560 dimensions into a handful of early ones. For the downstream nearest-neighbor task, that redistribution has to come from somewhere, and the full representation is where it comes from.
A brief aside on voyage-4
When we trained zembed-1 with MRL, we reproduced voyage-4’s NDCG@10 on our internal evals within noise. When we dropped MRL, we beat it. Voyage publicly confirms that all models in the Voyage 4 family use MRL. Both numbers are on our internal harness; we’ve open-sourced the benchmarking code at github.com/zeroentropy-ai/zbench so you can reproduce the comparison on your own data.
What we shipped instead: learned projection matrices
We ship six projection matrices with zembed-1, one per supported target dimension:
| Target dim | Matrix shape (stored) | File size |
|---|---|---|
| 1280 | 6.3 MB | |
| 640 | 1.6 MB | |
| 320 | 400 KB | |
| 160 | 100 KB | |
| 80 | 25 KB | |
| 40 | 6.3 KB |
Each stored matrix reduces dimension by a factor of 2. To project all the way from 2560 down to 320, the server composes three of them — the chain multiplies out to a single
What MRL gives that our projections don’t
We should also be direct about what we’re giving up. MRL gives you one genuine property our projections don’t: any prefix of any length is a valid embedding. If your retrieval pipeline depends on adaptive single-vector reranking — shortlist at 64 dims, rerank at 2560 using the same stored vector, with arbitrary intermediate stages — that flexibility is worth something.
We chose six fixed tiers because in practice every zembed-1 user we’ve talked to either stores at a fixed dimension or swaps dimensions at deploy time, not per-query. If you know you need continuous-dim truncation across the same stored vector, the trade-off goes the other way and MRL is the right tool. For the rest — the overwhelming majority of real-world RAG and search workloads — we think the
Results
The shipping projections beat the best MRL configuration at every supported dimension:
| Dim | MRL | Learned projection | Δ |
|---|---|---|---|
| 2560 | 0.4662 | 0.4948 | +0.0286 |
| 1280 | 0.4528 | 0.4795 | +0.0267 |
| 640 | 0.4258 | 0.4532 | +0.0274 |
| 320 | 0.3991 | 0.4196 | +0.0205 |
| 160 | 0.3565 | 0.3826 | +0.0261 |
| 80 | 0.2873 | 0.3068 | +0.0195 |
| 40 | 0.2021 | 0.2058 | +0.0037 |
(NDCG@10 on our 22-dataset real-world eval harness, averaged across finance, healthcare, legal, code, conversational, and general domains.)
The delta is roughly constant at +0.02 to +0.03 NDCG@10 from 2560 all the way down to 80 — including at full dimension. This is the core of the accounting argument from the previous section made numerical: MRL is paying the largest tax where you’d least expect it, at 2560 dims, because that’s the representation it had to redistribute away from in order to concentrate information in the early dims. The tax isn’t recovered at the low end either; the two approaches only converge at 40 dims, deep in the information-floor regime where both are capacity-bound and the projection’s edge collapses toward the noise floor.
A zembed-1 embedding projected to 160 dimensions still beats OpenAI text-embedding-3-small at its full 1536 dimensions on our eval:

A quick real-world test
Shortly after we shipped the projections, Mem0 — an open-source memory layer for AI agents — pointed their eval harness at zembed-1 at 640 dimensions. Their production model is Qwen3 0.6B, self-hosted on SageMaker for latency reasons. Their CTO reported back:
“We did some analysis and ze 640 is doing better than what we have on prod.”
zembed-1 is a 4B-parameter model. Projected to 640 dimensions, it comes in at roughly the same per-vector storage cost as a 1024-dim model, but with a substantially better retrieval ceiling.
How to use it
If you already have full-dim embeddings and want to avoid re-embedding, pull the projections from HuggingFace and apply them directly:
import numpy as np
from huggingface_hub import hf_hub_download
from safetensors.numpy import load_file

# ~8 MB total, download once
path = hf_hub_download("zeroentropy/zembed-1", "projections.safetensors")
mats = load_file(path)   # keys: "1280", "640", "320", "160", "80", "40"

def projection_matrix(target_dim: int) -> np.ndarray:
    """Returns a [2560, target_dim] matrix. Right-multiply normalized
    zembed-1 embeddings by this, then re-normalize, to get a valid
    target_dim embedding."""
    dims = sorted(int(k) for k in mats.keys())
    assert target_dim in dims, f"target_dim must be one of {dims}"
    i = dims.index(target_dim)
    proj = mats[str(target_dim)]            # [2*target_dim, target_dim]
    for upper in dims[i + 1:]:
        proj = mats[str(upper)] @ proj      # chain up to [2560, target_dim]
    return proj

# full: [N, 2560] from zembed-1, L2-normalized
P = projection_matrix(640)                  # [2560, 640]
reduced = full @ P                          # [N, 640]
reduced /= np.linalg.norm(reduced, axis=-1, keepdims=True)
This is byte-equivalent to what the API does server-side. Each matrix is itself a trained transform from
You can also request these vectors directly — simply pass dimensions to the embed endpoint:
from zeroentropy import ZeroEntropy

zclient = ZeroEntropy()
response = zclient.models.embed(
    model="zembed-1",
    input_type="query",
    input="What is retrieval-augmented generation?",
    dimensions=640,  # one of {2560, 1280, 640, 320, 160, 80, 40}
)
Run it on your own data
We’ve tried to present this argument carefully. We’re also aware that a blog post is not a substitute for your own measurements. If you’re evaluating zembed-1 against an MRL-trained alternative, the right thing to do is run both models against a representative slice of your own query–document pairs and look at the numbers. Our benchmarking harness is open source; the weights are on HuggingFace. If you find something we didn’t, we’d like to hear about it.
In the meantime: MRL served a purpose. It made flexible dimensions a product feature. It pushed the field to think about embedding geometry as something you shape during training rather than something you inherit from the loss. We’re grateful for the idea. We just don’t think it’s the best tool for the job anymore.
Grid-search scale. The frontier figure is from an overnight sweep training the final MLP projection layer (~74M parameters) of zembed-1 with a matryoshka objective added to the standard reranker-distillation KL loss. Each run trains for 2 epochs at batch size 128 with MATRYOSHKA_RATIOS = [1, 2, 4, 8]. We swept MATRYOSHKA_WEIGHTS[0] (full-dim weight), MATRYOSHKA_WEIGHTS[-1] (
Reproducibility across training regimes. We cross-checked the MLP-only frontier against two other regimes: full 4B-parameter post-training with matryoshka loss, and pretraining zembed-1 from scratch with matryoshka loss from step zero. Both regimes produce runs that land on the same
Training dynamics. The best runs reach their

Ground truth and eval validity. All NDCG@10 numbers are computed against Gemini-based linear-scan relevance judgments on our internal 22-dataset harness, built from real-world retrieval traffic. Using an LLM-as-judge to evaluate an embedding distilled from a reranker introduces shared-failure-mode risk; cross-validation against a human-labeled subsample and against alternative judges (Claude, GPT-5) is on our evaluation roadmap. We flag this openly rather than silently.